VIUM
The lifespan of a research subject with veterinary, husbandry, and study data events captured over time. Synched video allowed users to review every and any moment of a subjects life by jumping to an event of interest. Here we also see a metric called 'Breathing Rate', derived with computer vision instead of a traditional hands-on method that disturbs subjects and produces unreliable results.
About the PreClinical Space
Preclinical research is known for its unreliable study results. Promising therapies spend years qualifying for human trials only for researchers to discover show-stopping side effects. Highly variable data early in the drug development pipeline is a significant factor in exorbitant drug prices. The team set out to help scientists running rodent drug studies make more informed decisions at these early stages of research by increasing the velocity of data and providing decision support.
Updating the interface information hierarchy. This re-design scaled to supported studies with 'n' subjects.
My Role
- Product Management
- UX Researcher
- Lead Product Designer for all web interfaces
Original whiteboard of how customers flow through our web interface, what products and features they engage with at each stage, and how they could re-engaged with our product after a study was complete.
Outcome
After high-speed intensive user research and a prototyping phase, the team started building the first living informatics system capable of streaming study data near real time. This took the form of:
- A web interface scientists could use to monitor steaming data from ongoing and completed studies
- A web interface to review data and charts from ongoing and completed studies
- A web interface to order studies online
- Lab hardware and intelligent sensors driving novel health metrics
- Computer vision algorithms measuring and alerting on health indicators
- A lab workflow empowered by 21st century technology
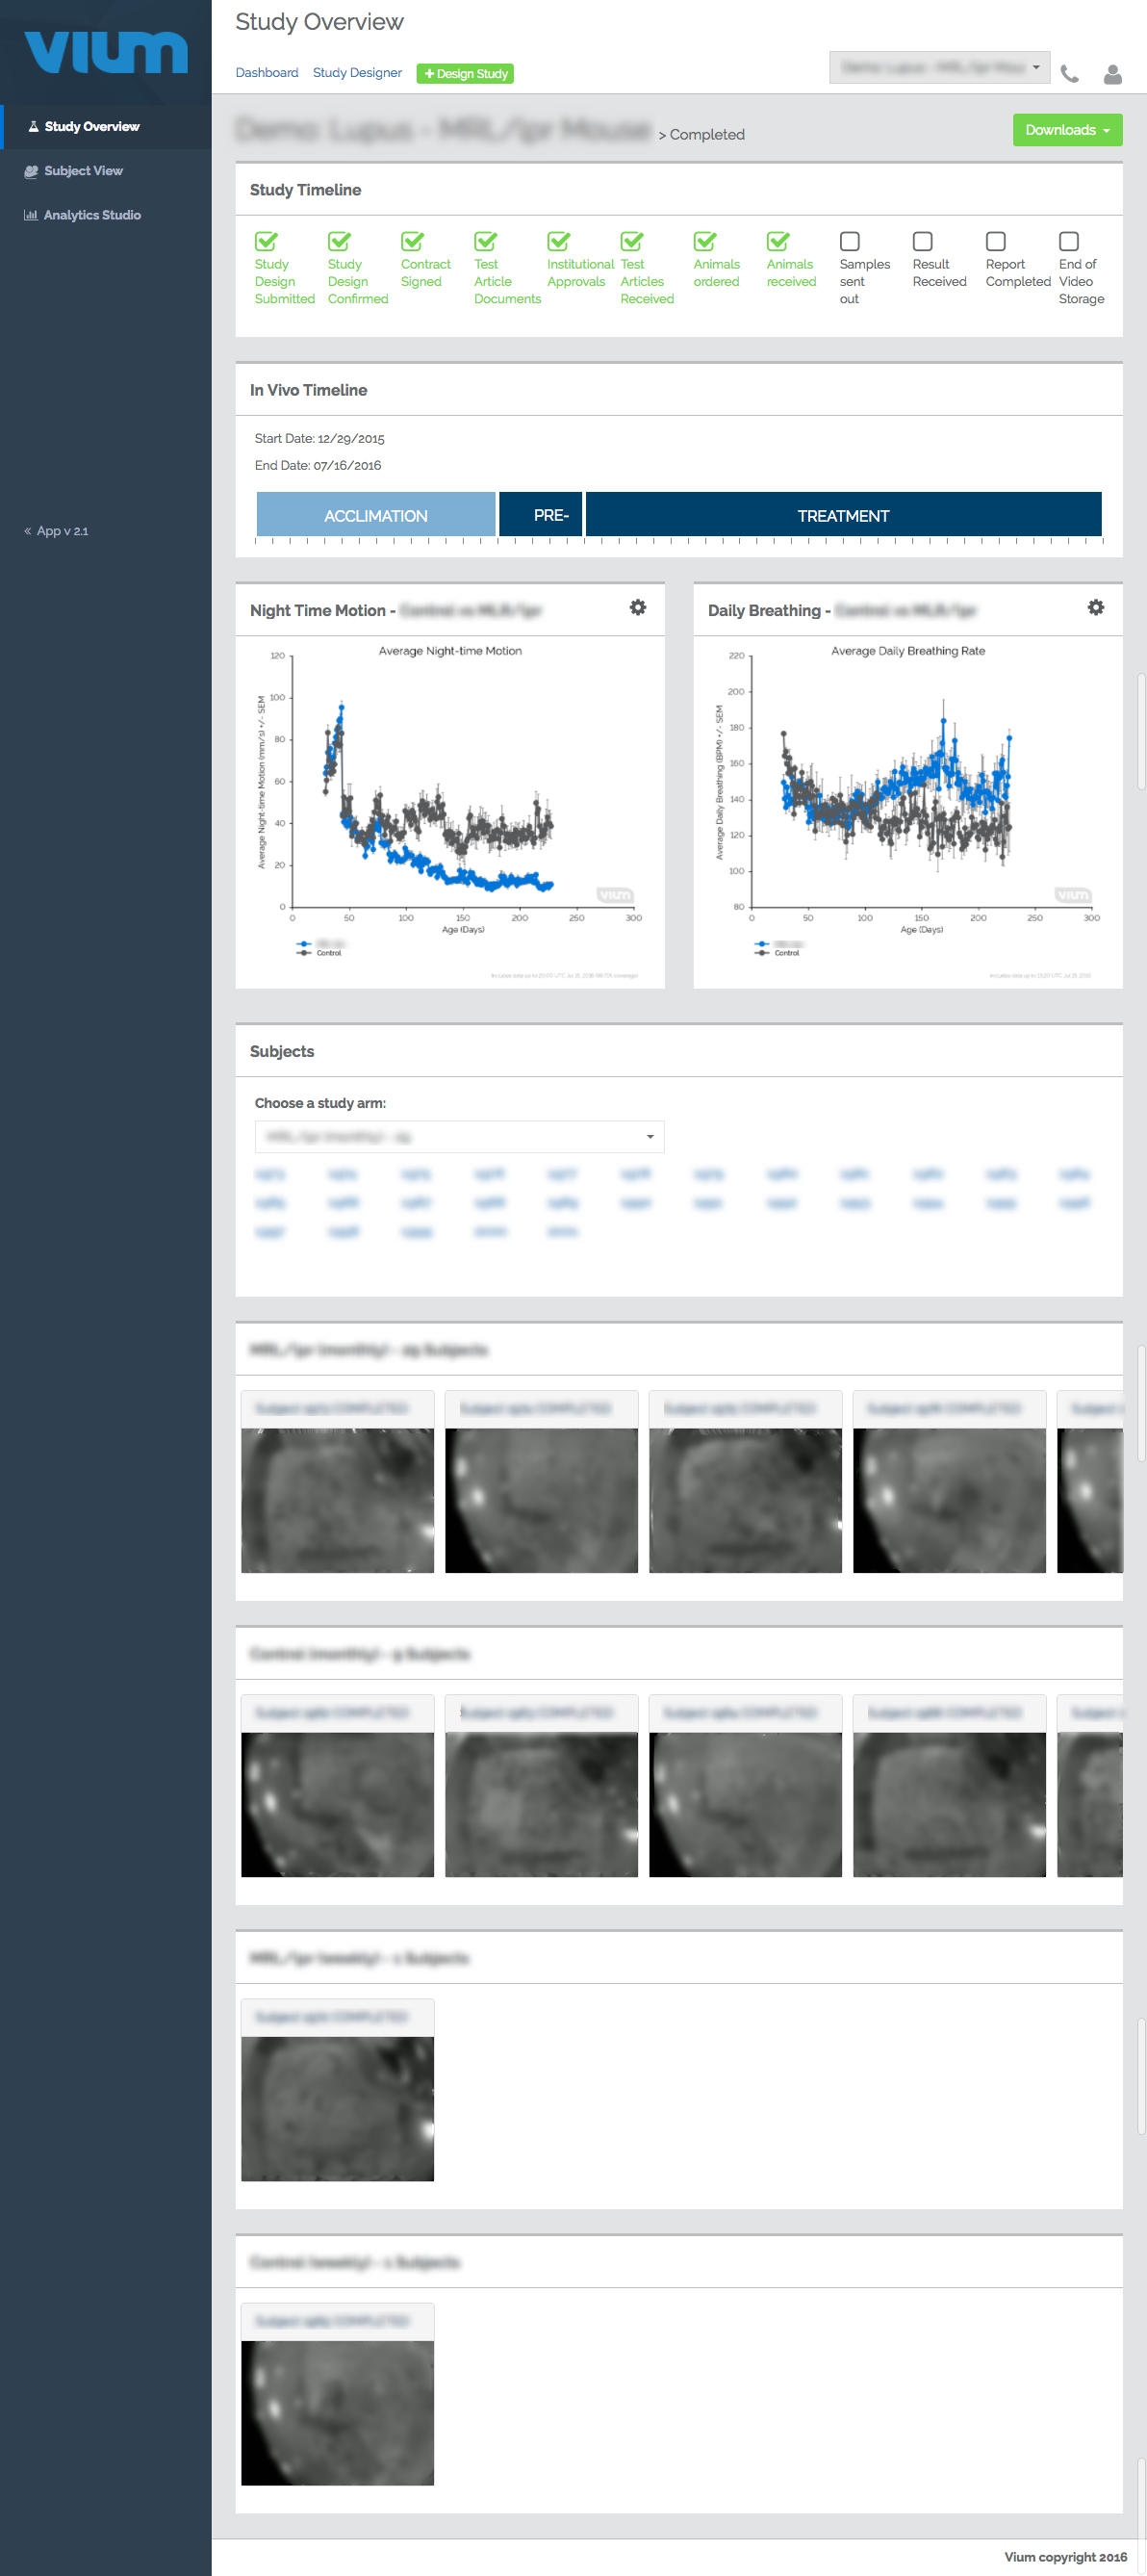
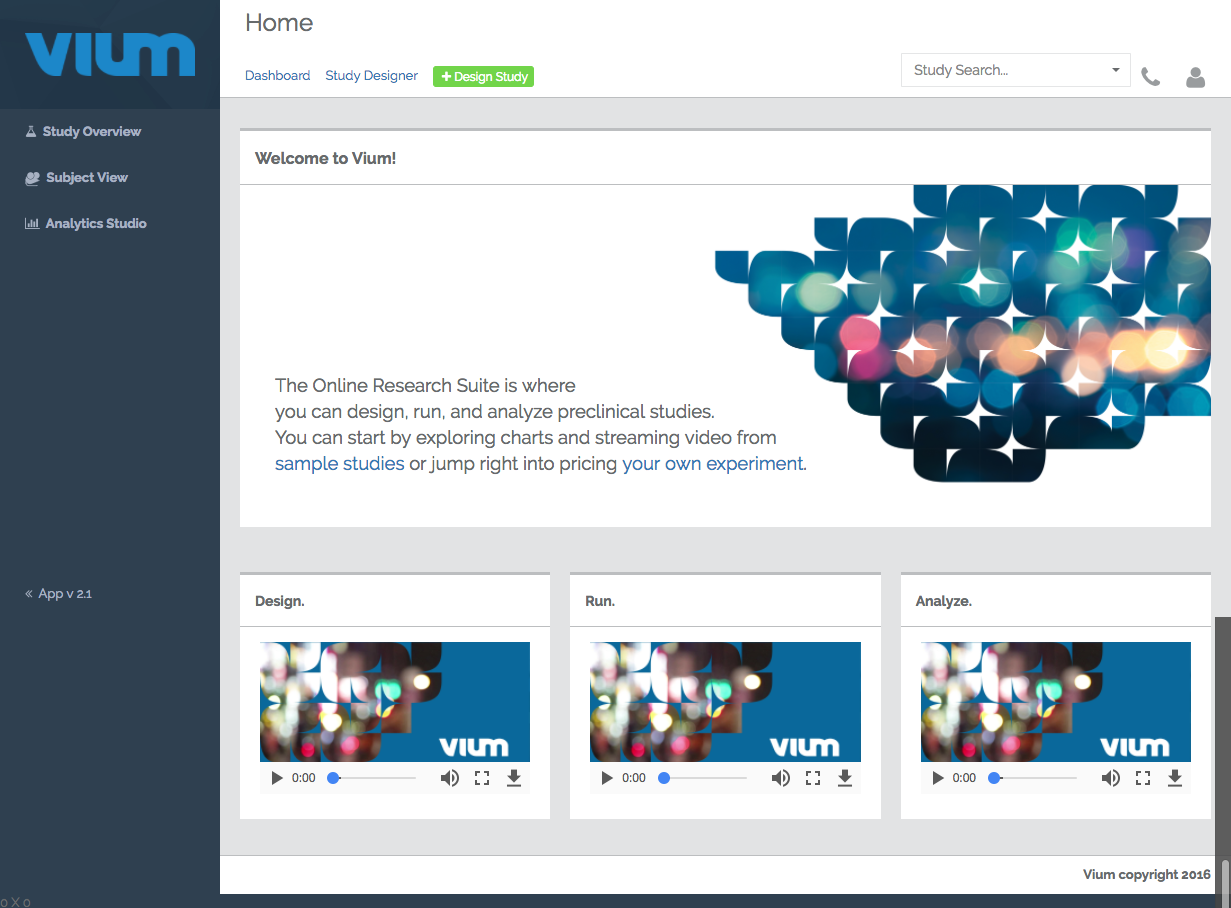
Version 2.1 web interface after the company exited out of stealth, completing an intensive re-branding process. Here you see the Study Overview, a Cage View of an individual research subject, and the Analytics Studio where users can generate their own charts. Data and video was streamed near-real-time. Charts of metrics derived with computer vision were generated in batch analyses to keep cloud compute costs low.
Research + Design Methods Used
- Prototyping
- Lo-fi + hi-fi wireframes
- Personas
- Directed + Non-Directed Interviews
- Card Sorting
- Facilitated Group Brainstorming
- Contextual Interviews
- Expert Interviews
- Moderated + Unmoderated Usability Tests
- Tree tests
- Expert Review + Walkthroughs
An early whiteboard of a study timeline based on expert interview UX Research. This was used as the basis for a data model update that allowed users to monitor study status across a variety of study types.
Original wireframe of the Study Designer and first attempt to architect a data model that would lead to a pricing algorithm. This prototype was also used to build consensus on the team around which types of studies we should offer and which market segment we should target.
Challenges
- Extremely limited access to end users required versatile qualitative UX Research methodologies.
- Workflow automation doesn’t happen overnight. Tooling data pipelines and calibrating sensors needed to be balanced with laboratory protocols that kept studies running safely.
- The market segment had yet to be identified. A strong rational explaining who we should target needed to be quickly developed in tandem with UX Research.
- Streaming and cloud-based processing were novel in this industry. Scientist users were accustom to evaluating completed studies with validated data. Finding ways to clearly represent incomplete mid-flight data was an important part of each data visualization.
- Sensors and algorithms raised new questions about lab protocol and SLAs. Exciting opportunities to improve the speed of alerting and care came hand-in-hand with ethical responsibilities. In addition, every new metric needed to be rigorously validated before scientists would even consider running a study with one.
- There was no such thing as a “typical study.” When asked how they evaluated study results, our scientist users had very different methods. The site's information architecture would have to be largely shaped by indirect UX Research methodologies.
- Ordering research studies online was a novel concept approached with suspicion. Studies were traditionally ordered through a series of personal calls spanning weeks of negotiation. Research timelines and pricing often relied upon personal connections. Suggesting this process could be automated was met with hope and skepticism.
- Studies requiring subjective human measurement couldn't scale. Traditional preclinical measurements often have to be performed by the same individual to avoid bias. Any manual measurements meant small sample sizes prone to human error. We felt our sensors and data scientists could be more objective at scale.
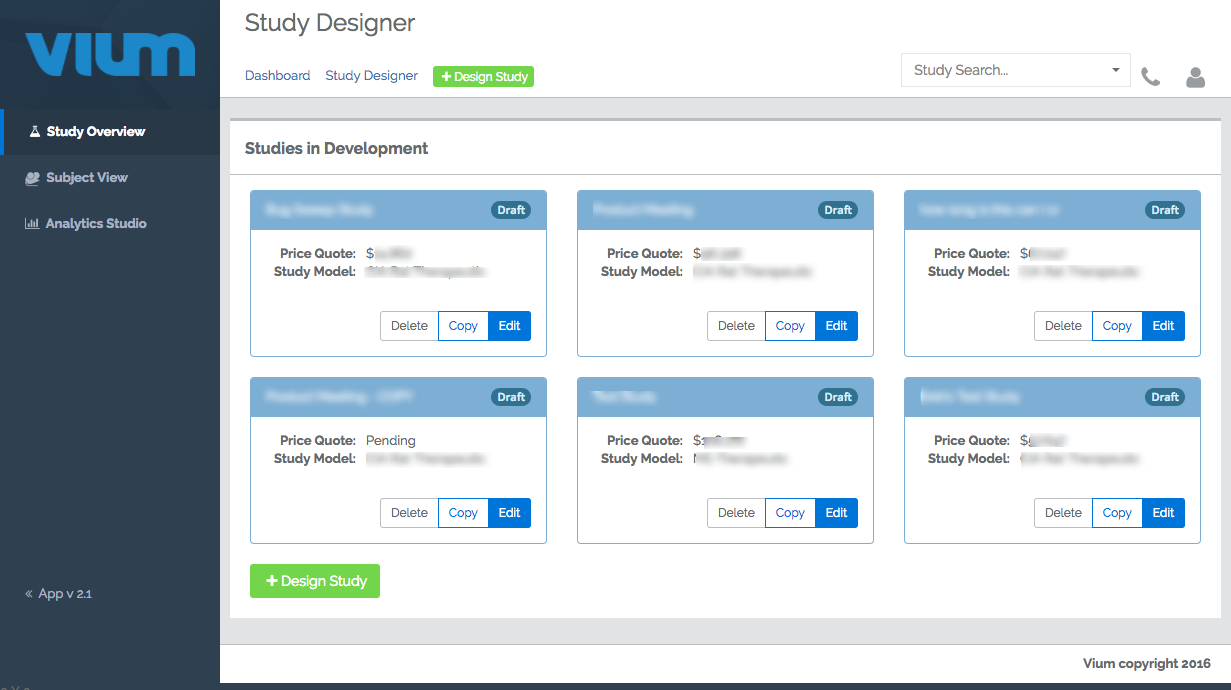
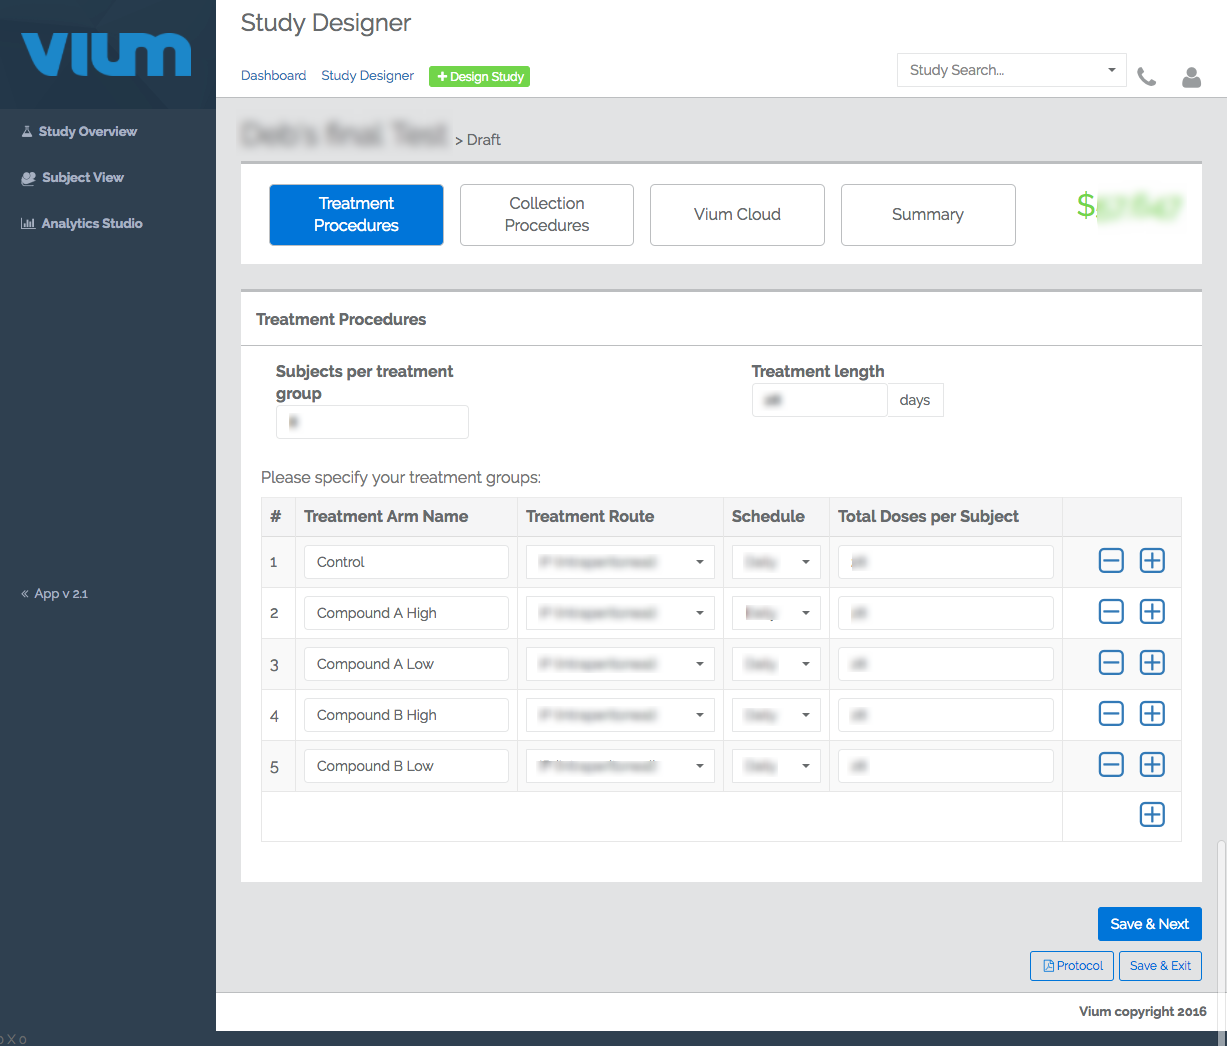
Version 2.1 Study Designer. For the first time, scientists could develop and order studies online with transparent pricing. Introducing this to users in the preclinical research industry was similar to explaining that you no longer needed a travel agent to book a flight. Users were able to price research methods they normally didn't consider.
Key insights:
Theoretical technologists who weren’t used to life-or-death issues ran into hard-and-fast design parameters. Lab workers sometimes had to do double the amount of work to test prototypes that would ultimately cut their work down to a tenth of the effort. Even before customer needs were considered, balancing competing technical priorities and protocols across a diverse team of experts required close collaboration and strong communication. Cross functional coordination and being able to deeply engage with specialists was key.
Hi-Fi prototype of the Study Designer (left) which let users order a studies online with human defaults and safety parameters making it easier for scientists to design and order animal-friendly studies. Wireframe of the Study Overview (right), intended to summarize ongoing experiments.
Streaming research data from an ongoing study implied a massive paradigm shift. Streaming study data could still support decisions but our scientist users were only accustom to seeing complete and fully validated data. Visually communicating this difference in the interface was important.
The information architecture was heavily shaped by UX Research from prototype to launch. Being able to quickly synthesize qualitative results gave the team a significant advantage. Outside of veterinary LIMS systems, there was little president for a data-heavy web interfaces in this industry. It was critical to understand how scientists thought about experiments from the ground up.
Clear corporate goals brought a diverse technical teams together. Coordinating between hardware, the laboratory, data science, dev ops, biz dev, backend, front-end, and corporate teams required a massive amount of code-switching. It also provided a window into how corporate goals can affect groups differently. Maintaining a clear line of communication with each team was important for avoiding error and spotting opportunity.
Roadmapping with departments who held wildly different objectives required clear visuals and structured meeting agendas. What was once a casual conversation needed to be structured as the company grew. Abstract thinking scientists debating hard-nosed technologists under the mounting pressure of business objectives and technical debt, were all healthy parts of the company's growth. But that energy needed to be harnessed into actionable decisions.
Conflicting notions of time challenged the developing data model and pricing algorithm. Researchers think about study design differently depending on the type of study they want to run. UX Research and many rounds of prototyping helped us normalize timelines, procedure pricing, and the cost of laboratory resources.
Data visualizations helped skeptical users evaluate new metrics that were enabled by sensors and computer vision. Creative approaches to communicating mid-flight data or incomplete data with higher margins of error helped with the acceptance of streaming metrics.
Modular design helped us tool our data pipeline. This was critical as processing a growing volume of video began to swallow our cloud computing resources.
Implementing Agile methodology, migrating to JIRA, and tightening acceptance criteria helped our product mature and brought order to our continuous release environment.


