Workday
A cloud-based system that supports hiring, payroll, planning and financials. It’s the backbone of many Fortune 500 companies. It manages high volumes of data with complex security models for large international companies.
Discovery Boards
A data viz dashboard platform. It lets HR Analysts explore data by making drag-and-drop custom charts with powerful drill features.
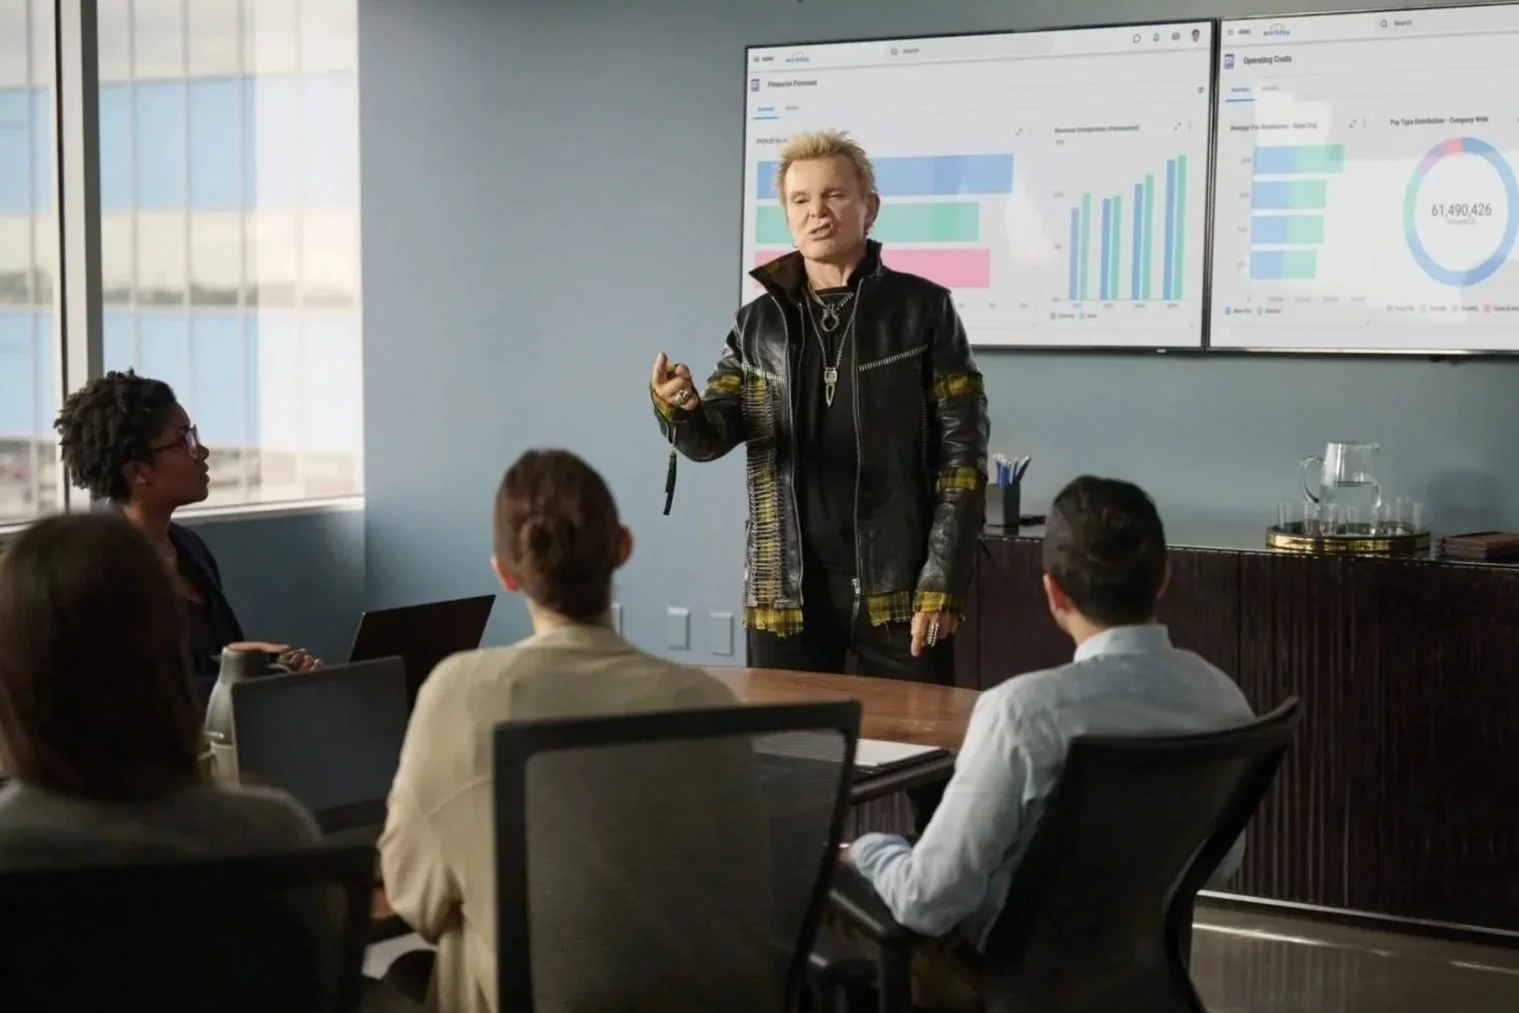
Discovery Boards was the only product, out of approximately 30, featured in the Workday Super Bowl Ad.
My Role
Lead Product Designer
UX Researcher
Visual Information Architect
Involvement in almost every feature and strategy as the product evolved over 6 years
Case Study 1: Exposing Filters
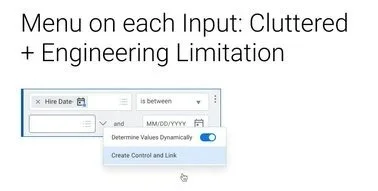
Chart viewers wanted to be more self-reliant in filtering the data on their dashboard, but not overwhelmed with technical settings navigated by Chart Creators. Chart Creators want to expose only select filters to Chart Viewers Chart Creators without having to make multiple tailor-made charts for each department. Creators and Viewers have different security privileges. Thinking through the override logic and when to fire the query is important as The Chart Creators will have 2 sets of filters that can update their charts.
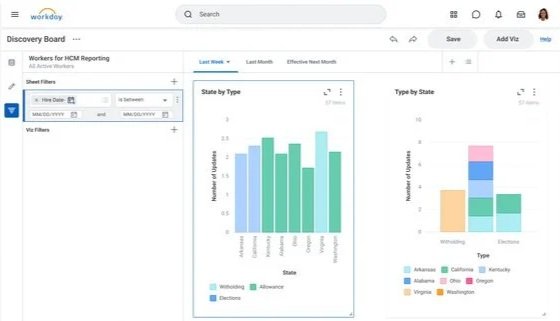
Before
Chart Creators want to expose only select filters on the left to Chart Viewers.
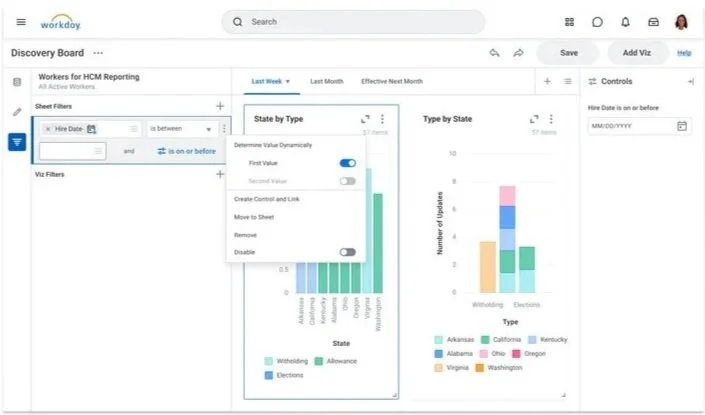
After
Chart Creator can control both filters and controls. Both elements update the charts with intelligent overrides. The Chart Viewer get a Controls panel scoped to what they are allowed to change.
Requirements
Multiple input filters
Static and Dynamic data types
No engineering budget to create new UI elements
Timing a heavy query
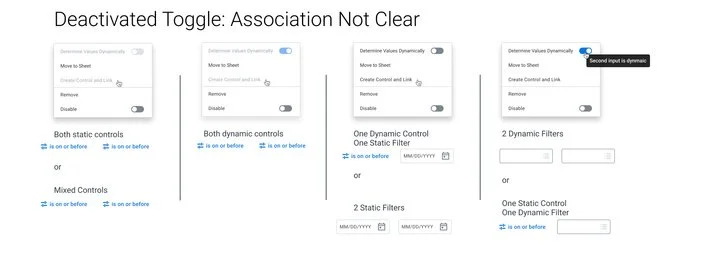
At no point can the charts be inaccurate to either the creator or the viewer
Logical overrides
Chart creator might have different security privileges than the ultimate chart viewer
Outcome
The product was successful. Chart Creators could make a board once instead of custom boards for each department.
Customers requesting the feature were able to figure it out, and it increased sharing.
Kept Engineering budget low by cobbling together existing UI elements in a logical way
Iterations
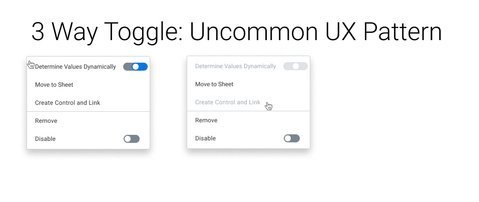
Reviewed in presentation. This project is intended to demonstrate creative problem solving on a tight budget.
Case Study 2 : Internationalization
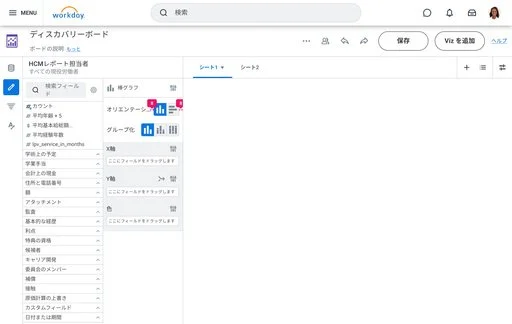
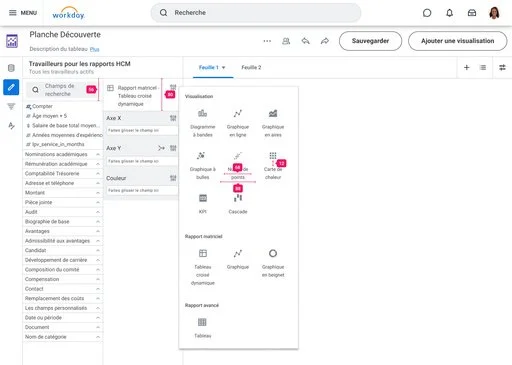
Translating an information-dense dashboard to capture the Canadian, European, and Asian markets. Additional accessibility requirements meant designing for human and non-human readers. Automated translation could only go so far. That meant working with both a human and non-human agent to design a multi-cultural experience.
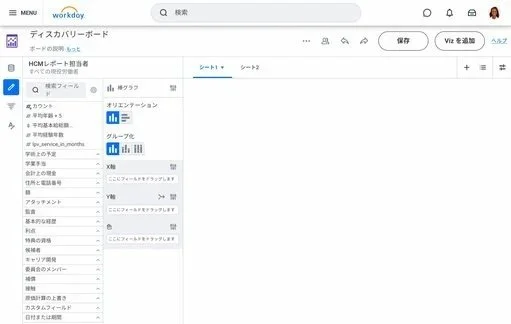
Global corporations needed static strings and user generated data, in multiple languages.
Requirements
Designing with Automated tools to keep Engineering budget low
Meet government and cultural standards
Automated and human translation incorporated into the design process
Accommodate pixel level readability challenges
User-generated data in multiple languages blended with automated data
Accessibility : Human and non-human readers
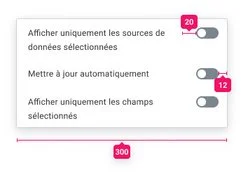
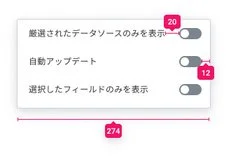
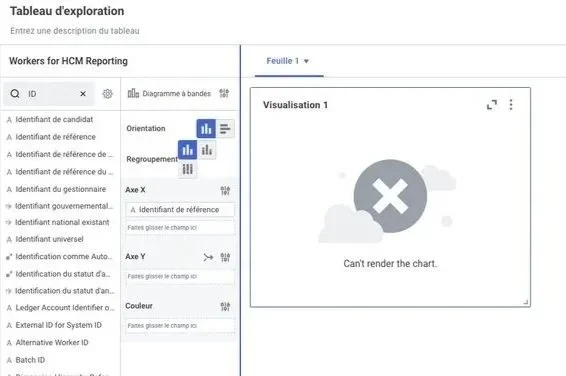
Jumbled Buttons
Before
Buttons cluttered by some languages but not others. Triggered a debate on their significance in the user flow.
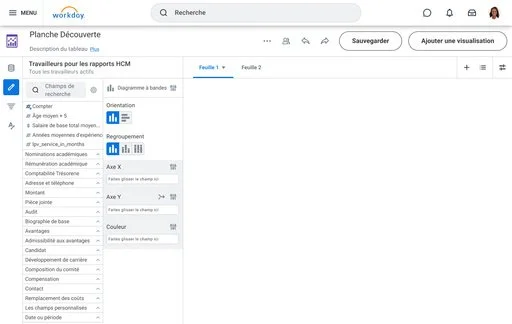
After
Outcome
Meet government and cultural standards
Eliminated interface redundancy
Balanced multiple levels of automatic translation from both Workday and browser
Translated both static strings and user generated data
Mixed languages displayed in dashboards and charts
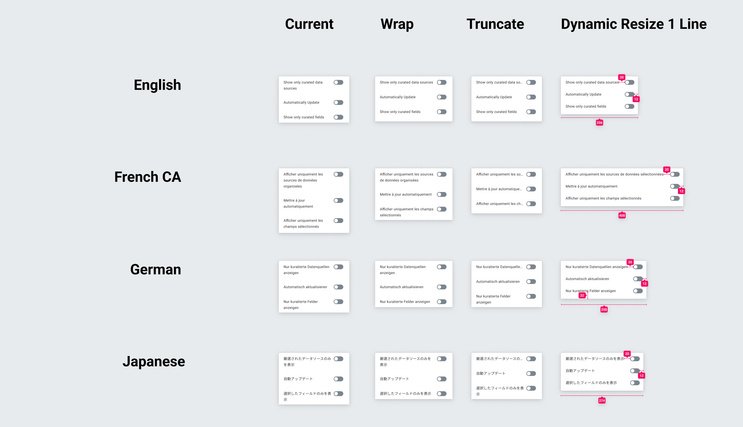
Japanese was challenging because of character density and widow characters. French was challenging because of long the words and no engineering budget to intelligently break the words down in a way that was grammatically correct.
Menu Redesign
Iterations
Before
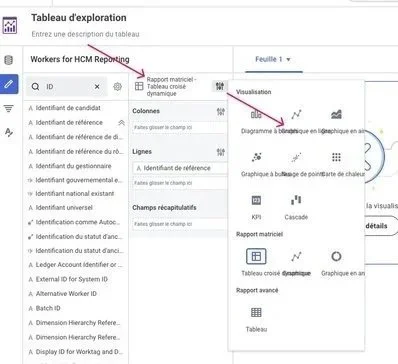
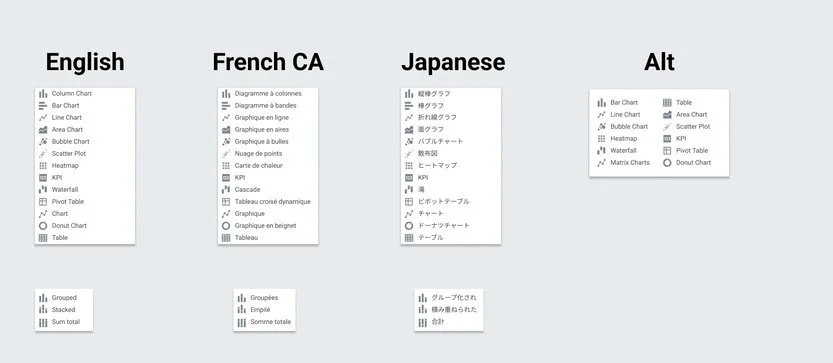
Menu needed to be redesigned with a new approach to iconography. Ultimately, a more standardized look and focused workspace.
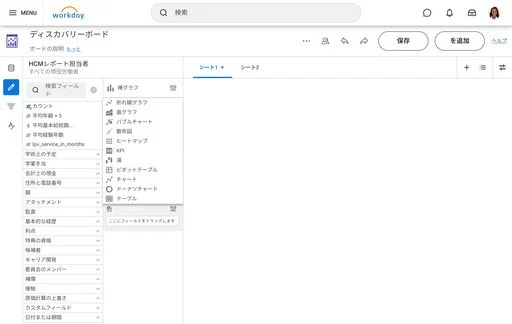
After
Reviewed in presentation. Menu and toggle explorations using automated tools and human translation.